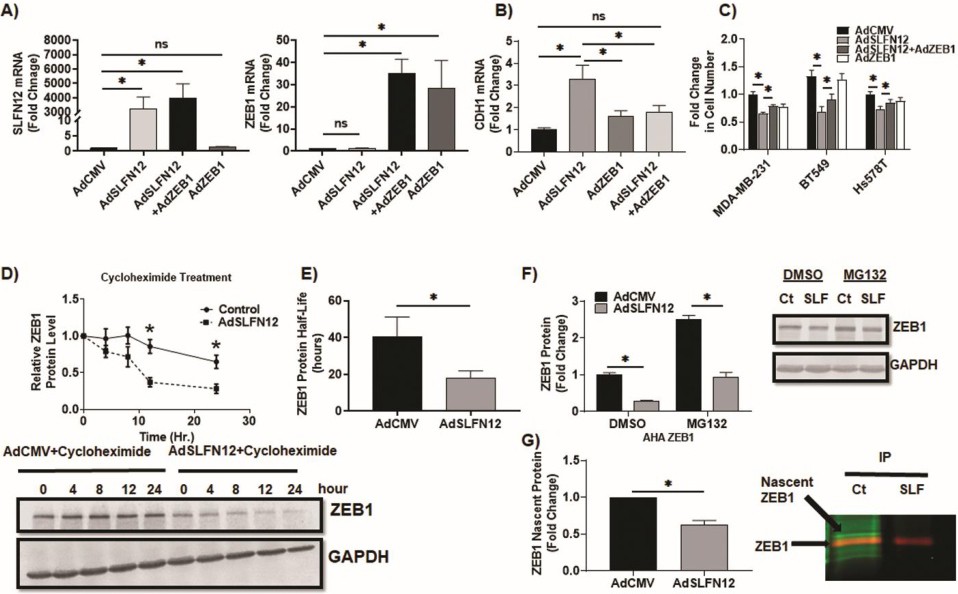
Fig. 6. Schlafen12 acts at least in part through post-transcriptional modulation of ZEB1 protein. A) SYBR Green qPCR analysis of ZEB1, SLFN12 and B) E-cadherin (CDH1) mRNA levels in MDA-MB-231 cells, 72 hours after treatment with one of the following: AdSLFN12, AdZEB1, AdCMV or AdSLFN12 + AdZEB1. (One-way ANOVA, n=16, *p<0.05). C) Proliferation study using CCK8 assay in MDA-MB-231, BT549, and Hs578T cells, 72 hours after treatment with AdCMV, AdSLFN12, AdZEB1, AdSLFN12 + AdZEB1, data represent fold change in cell number normalized to the mean of AdCMV (MDA-MB-231 n=7, BT549 n=18, Hs578T n=11, *p<0.05, student t-test was used with Bonferroni correction). D) ZEB1 protein decay analysis by western blot in MDA-MB-231 cells at 0, 4, 8, 12, and 24 hours after treatment with 10µg/ml cycloheximide in cells treated with AdSLFN12 or AdCMV for 72 hours. E) ZEB1 protein half-life analyzed by western blot in MDA-MB-231 cells at after treatment with 10µg/ml cycloheximide in cells treated with AdSLFN12 or AdCMV (as control) for 72 hours. ZEB1 half-life was calculated by online calculator (https://www.calculator.net/half-life-calculator.html). F) ZEB1 protein levels analysis by western blot with representative blot images in MDA-MB-231 cells 72 hours after treatment with either AdCMV or AdSLFN12 in presence of DMSO or MG132 (10µM) for 12 hrs., GAPDH used as a reference protein and all data normalized to AdCMV+DMSO group (n=3, *p<0.05). G) Translational assay of ZEB1 analyzed by western blot of MDA-MB-231 72 hours after treatment with either AdCMV or AdSLFN12 in presence of 50µM of L-AHA for 8 hours followed by ZEB1 immunoprecipitation, with representative blot image showing immunoprecipitated ZEB1 protein (red) and the nascent ZEB1 protein (green). Nascent ZEB1 band signal was normalized to immunoprecipitated ZEB1 band signal (n=3, *p<0.05). All error bars shown represent standard error of mean.